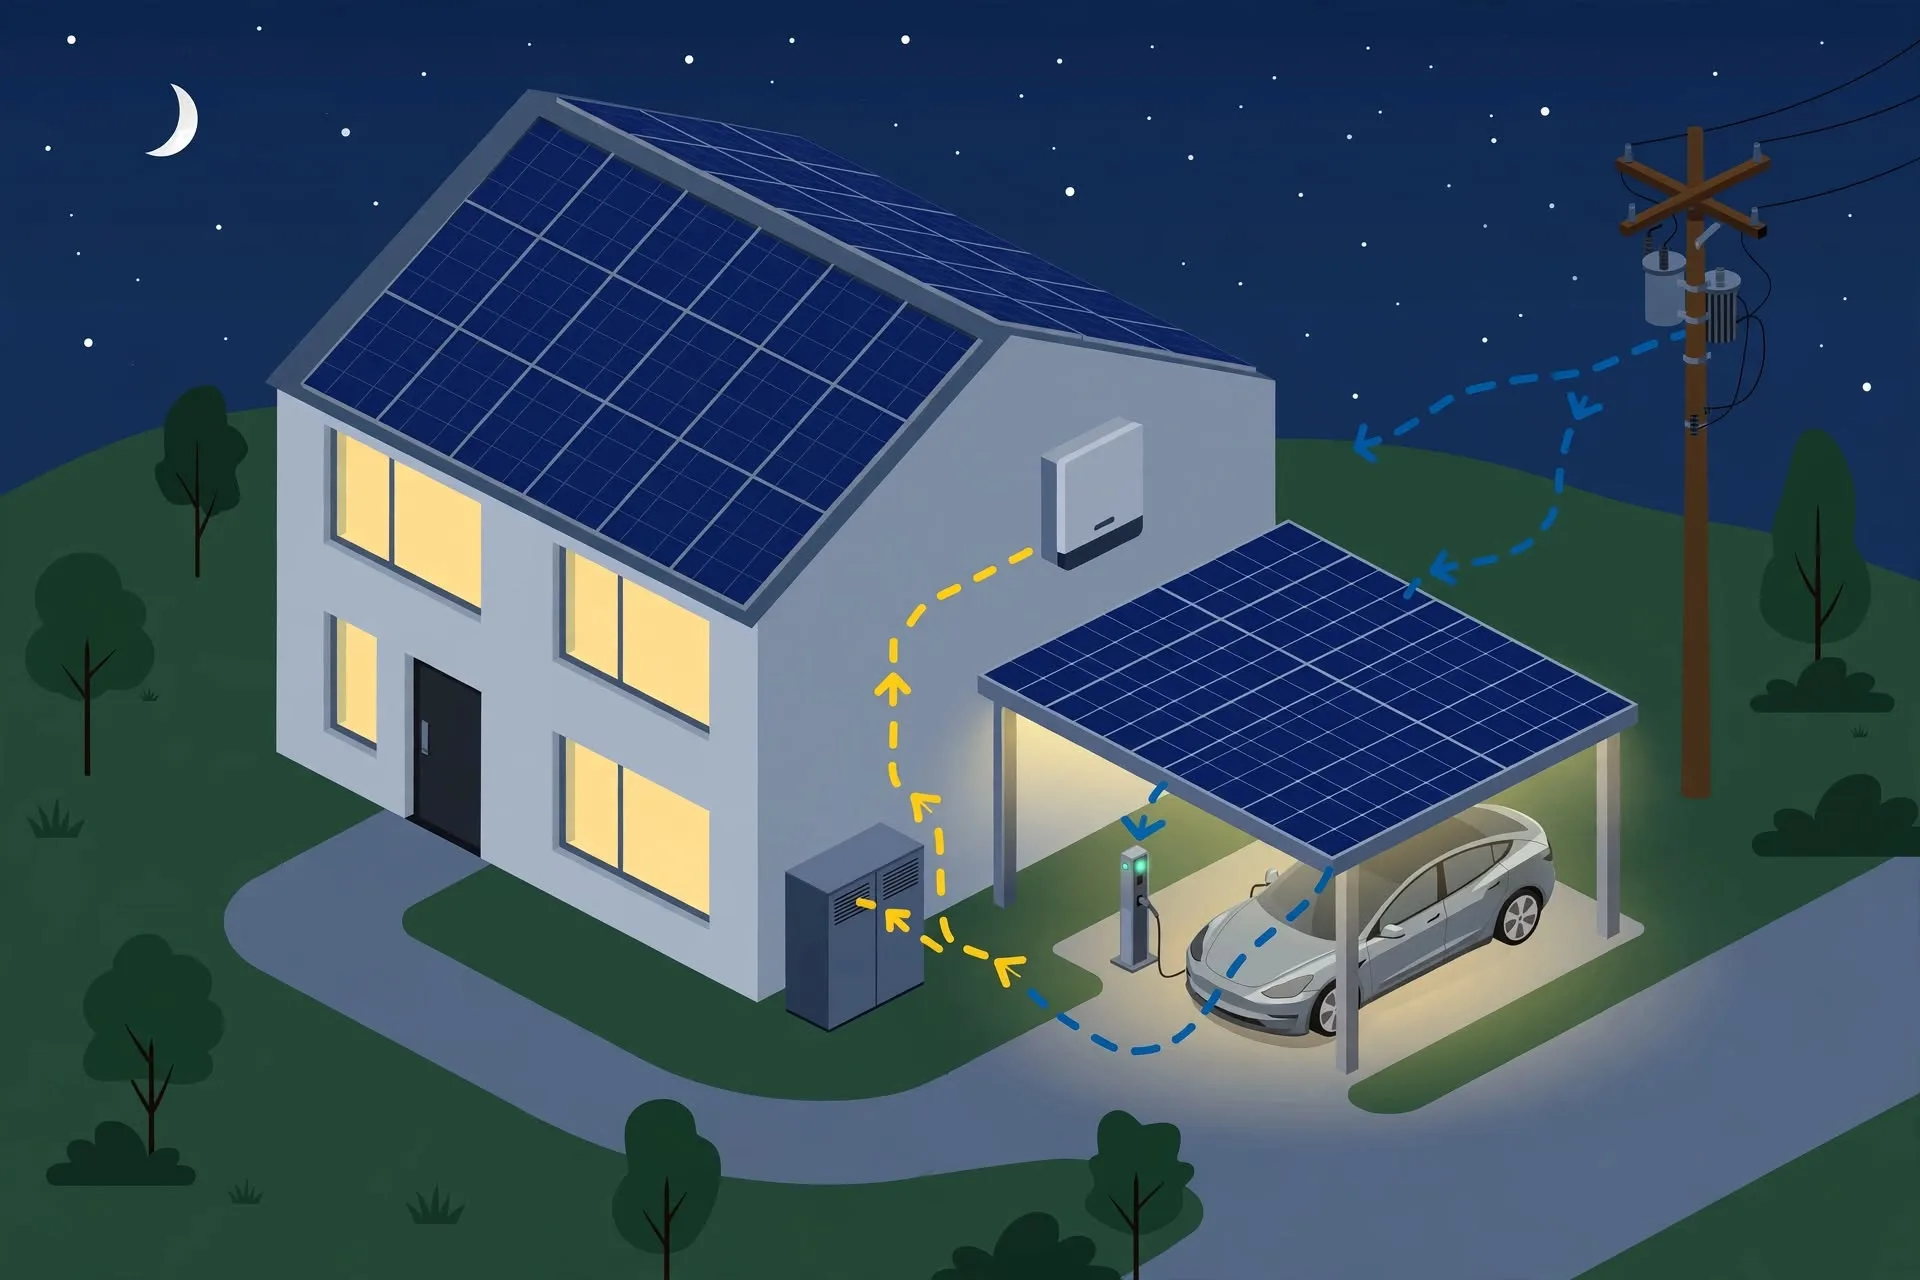
A separate portal for every vendor.
Inverter, battery, charger and meter each live in a different app. Comparing them is manual work, site by site.
Vendor-independent monitoring and decision support for installers, operators and industrial sites: 15-minute energy balance, demand peaks, tariff and battery simulation — per customer, under your brand.
Monitoring and simulation. No device control.
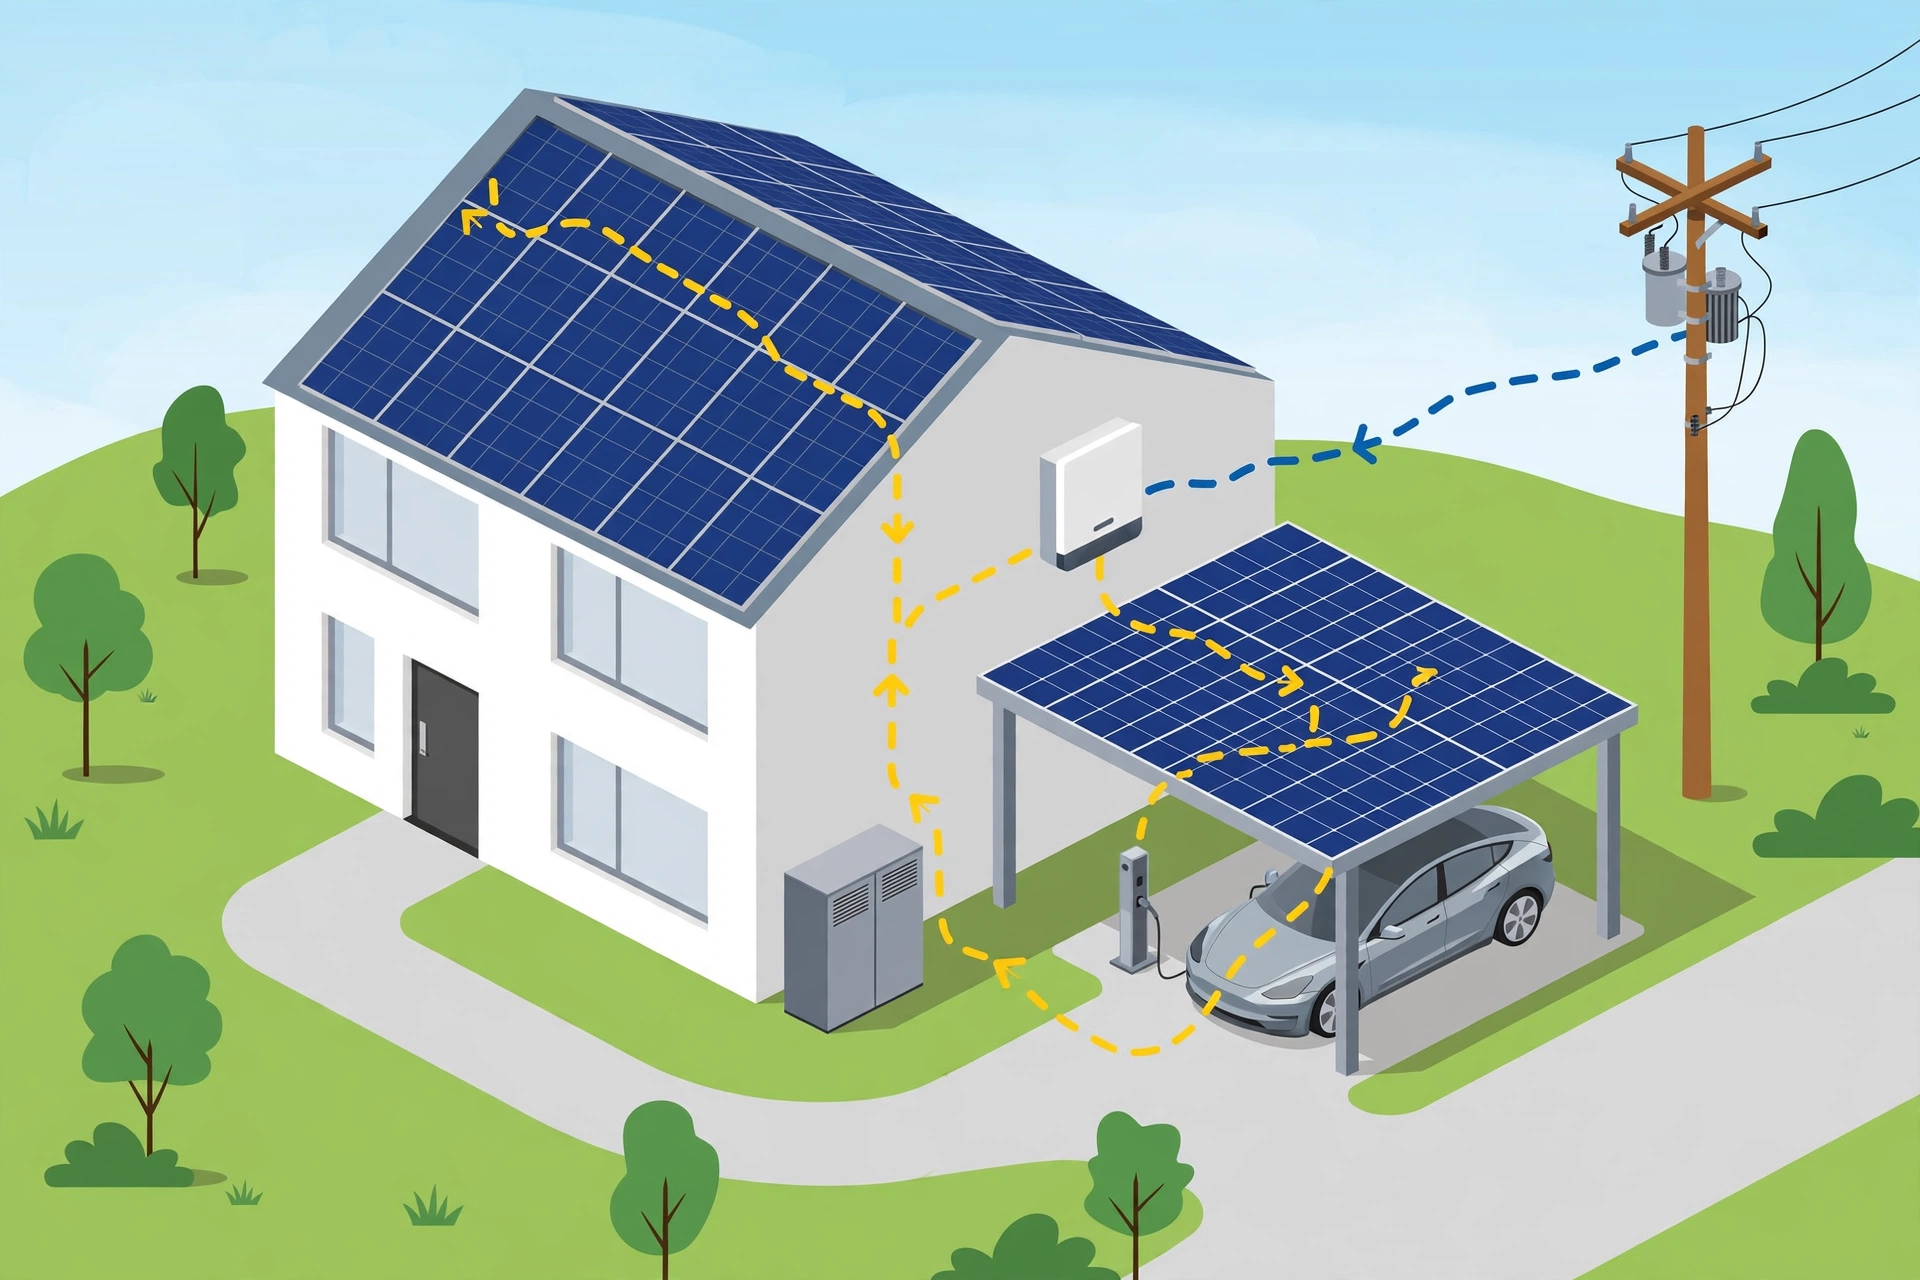
See production alongside charging timing.
Reduced motion: static scene
One interface for your entire installed base: sites, data quality and alerts — under your brand.
For partnersFOR INDUSTRIAL AND COMMERCIAL SITES15-minute energy balance, demand peaks, tariffs and battery schedules in one model — before and after the investment decision.
For industrial sitesInverter, battery, charger and meter each live in a different app. Comparing them is manual work, site by site.
Missing data, an underperforming system: without shared monitoring the problem often shows up on the bill.
When power is expensive and what a battery is worth can be calculated from 15-minute data — not from annual averages.
Understand your system — without piecing together three different apps.

When does solar produce? What does the battery store? See how your home’s demand is met.
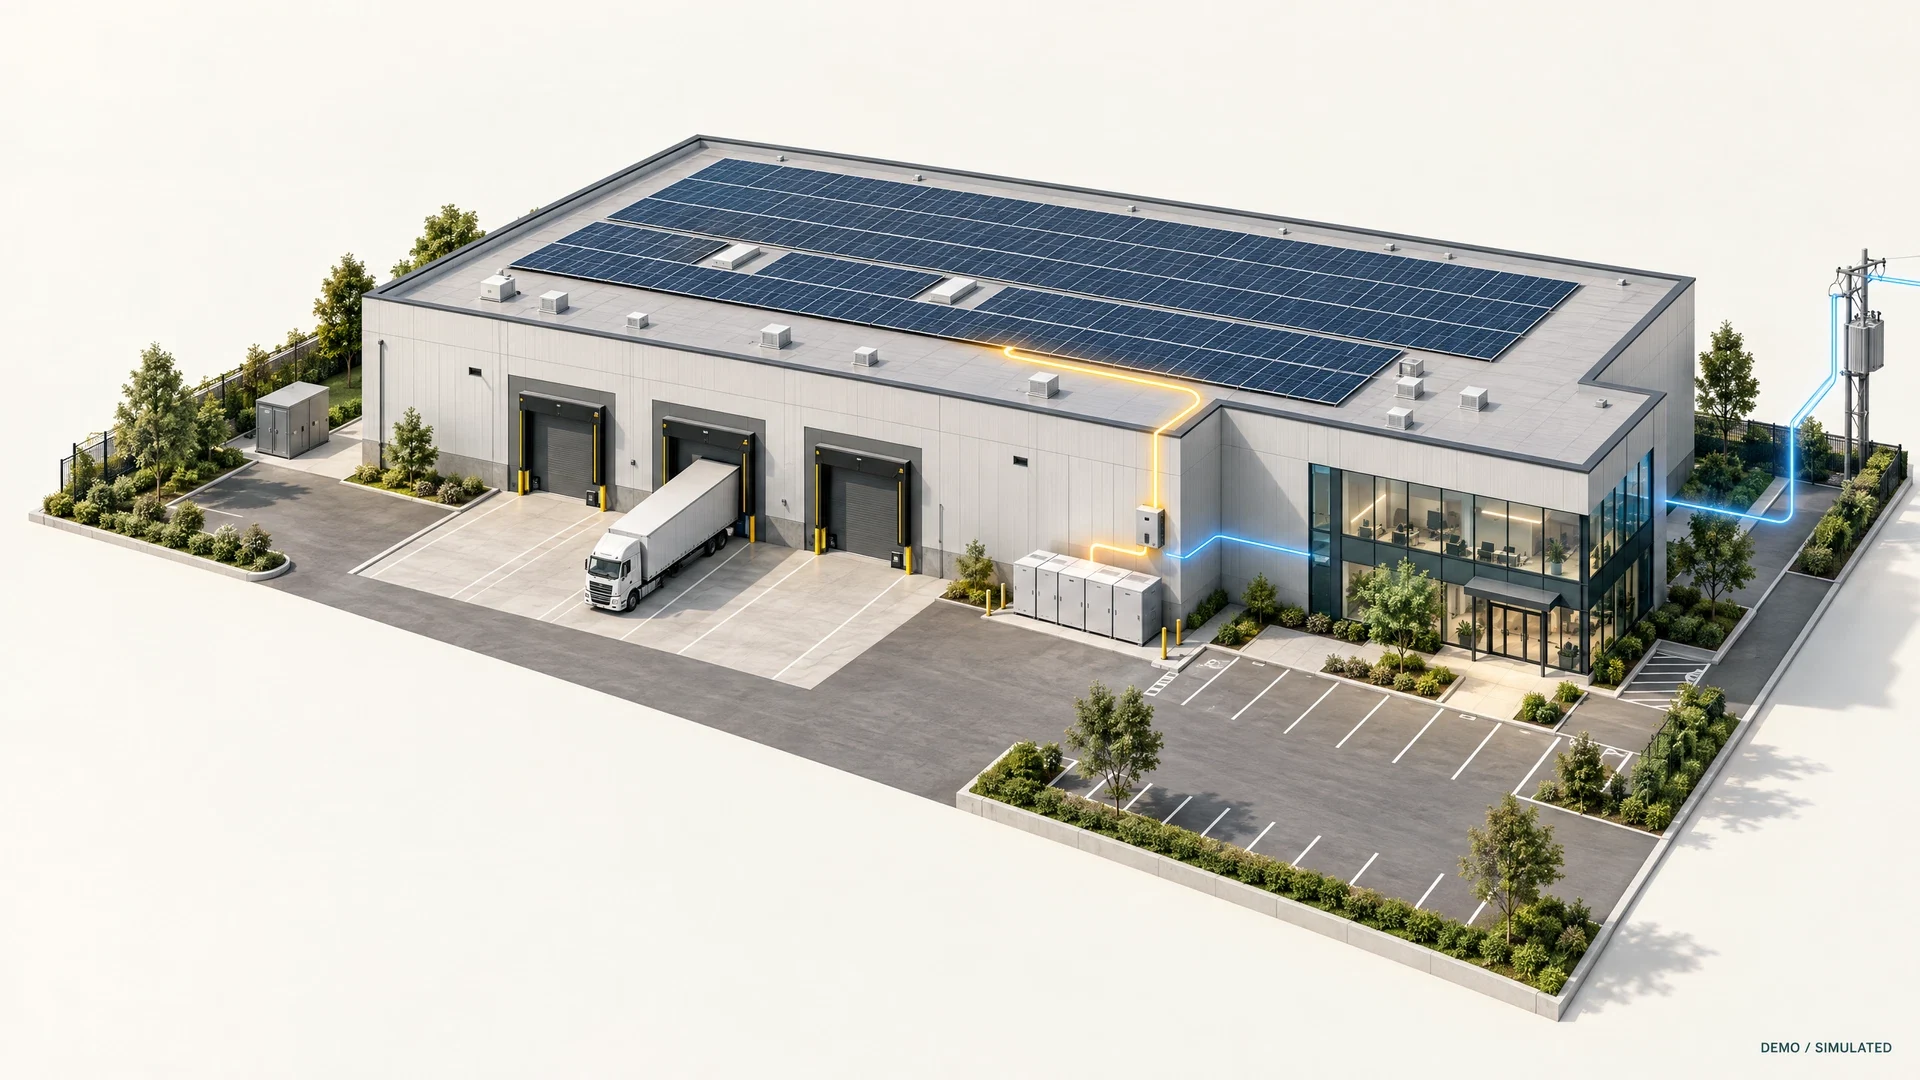
Consumption patterns, generation and demand peaks. A shared perspective for daily operations.
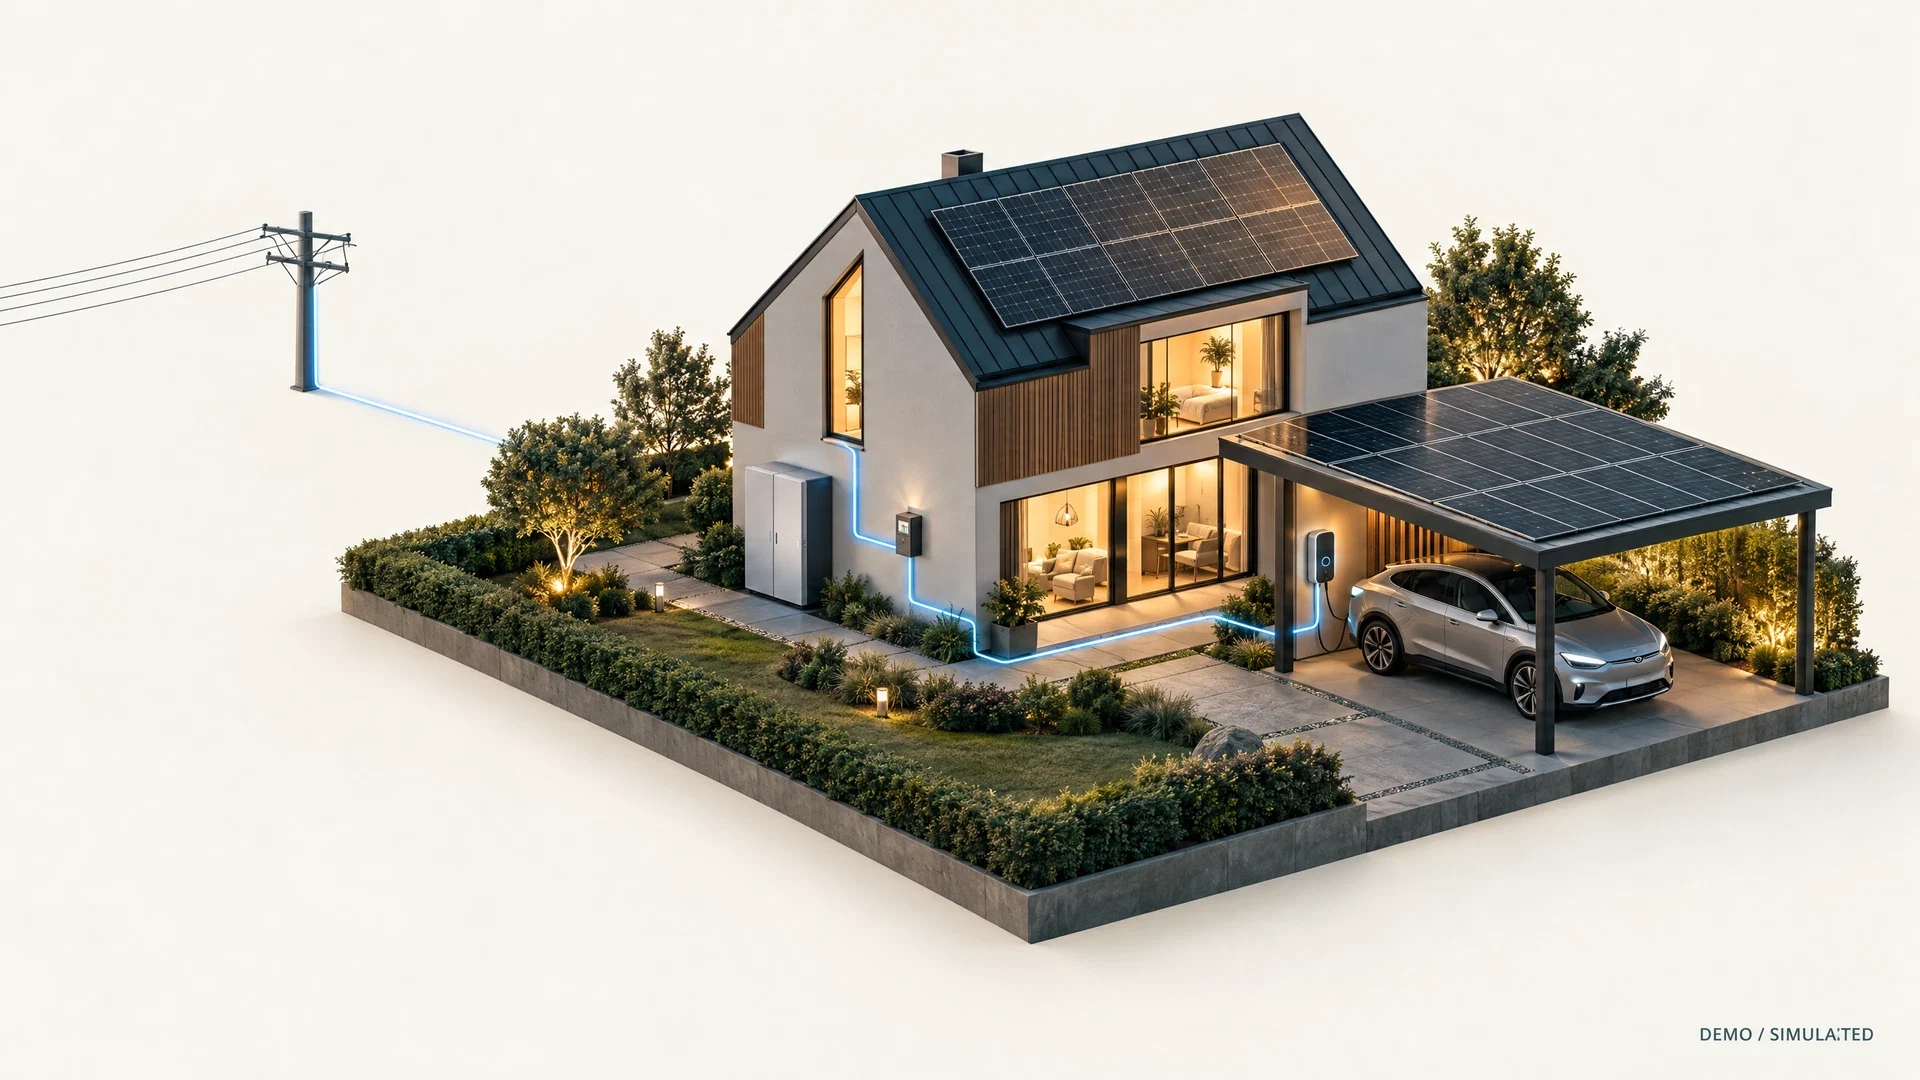
Vehicle and charger, identified separately. Understand charging windows alongside the rest of the system.
Manage installed systems by customer and site. The interface carries your brand, and access is role-based. Data and overview for your O&M service — not another vendor portal.
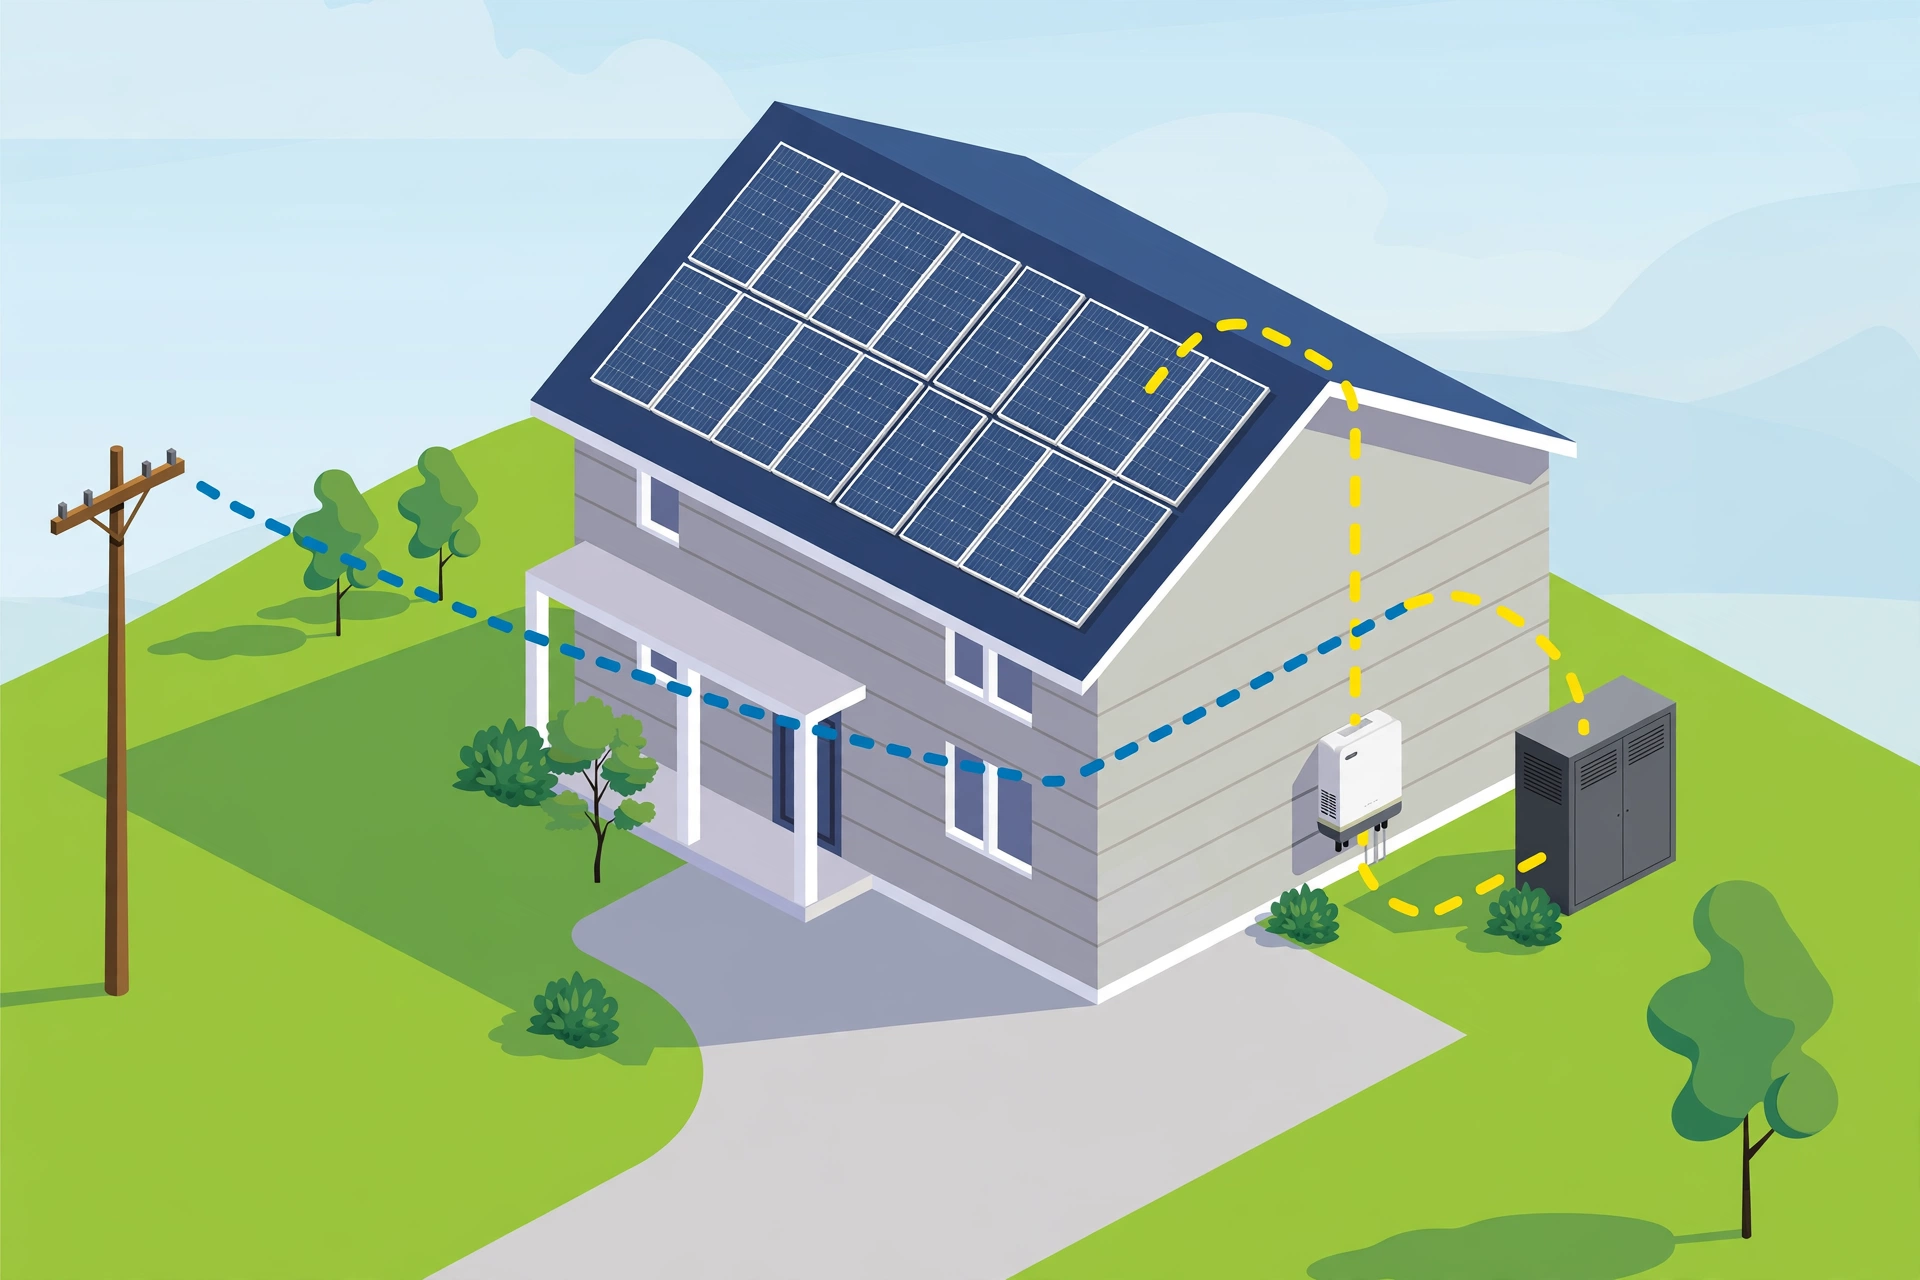
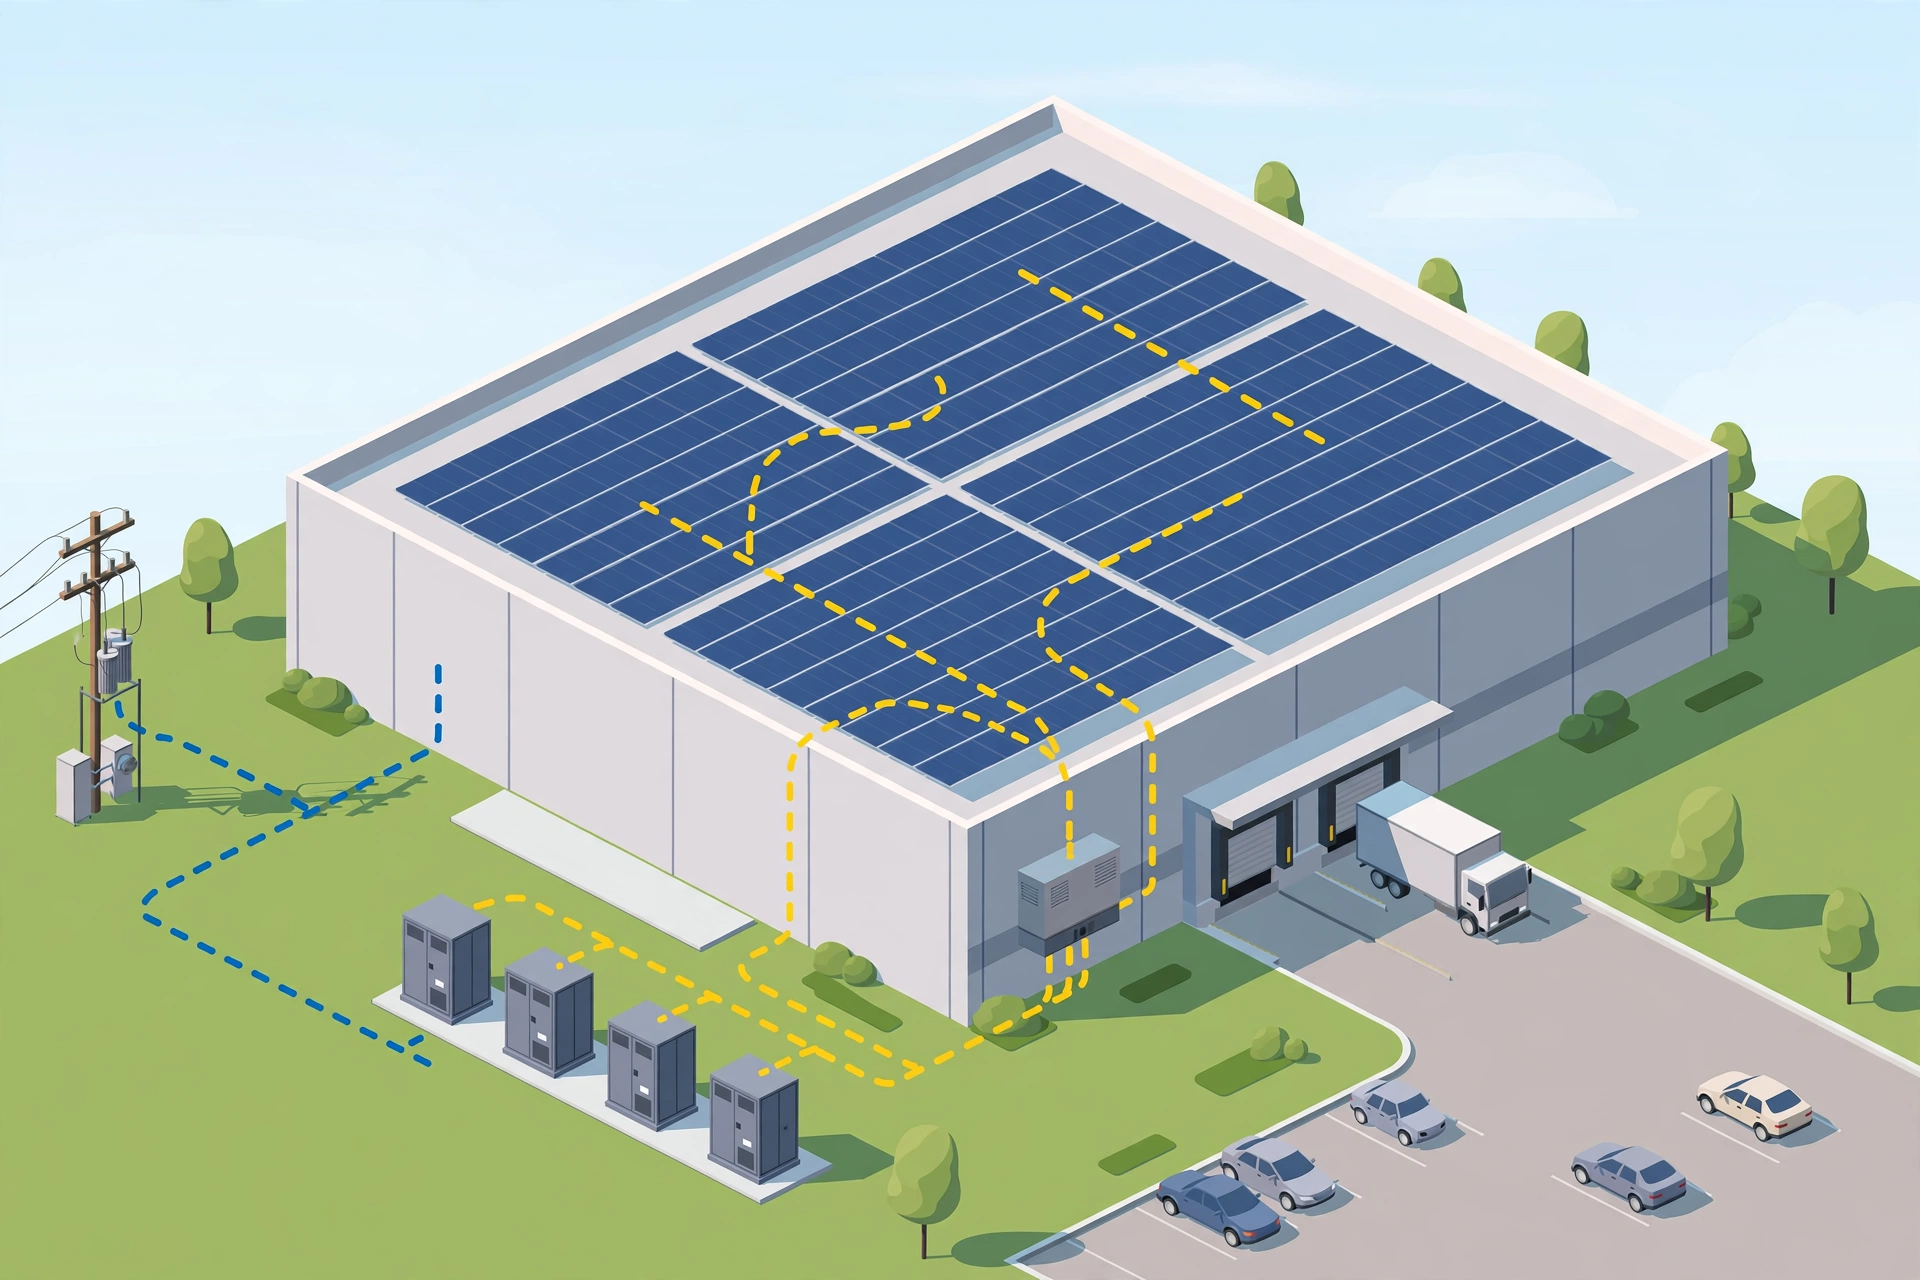
Three demo sites. No live customer data or portfolio aggregate.
Factory, cold store, logistics centre: daytime demand, peaks and the tariff together decide what solar or a battery is worth.
Discuss a site pilotProduction, consumption, import and export on one timeline, per site.
When and by how much demand rises — and what a battery schedule would change.
A battery schedule optimised on a time-of-use tariff, with visible assumptions. Decision support, not automation.
A consumption profile for PPA or ESCO offers, baseline and post-measure time series for energy-efficiency certification. Certification is done by an energy auditor; the platform provides the data.
In the platform: works today, shown here on simulated data. In pilot: verified together on your data.
Choose a component. We explain what it means — and where the demo reading comes from.
Solar output changes through the day. kW is the average power over the selected 15-minute interval, not daily energy.
Paths connect to a shared site energy bus. They do not claim separately measured solar-to-vehicle energy allocation.
Inverter, battery and meter data with read-only access. We do not control devices.
A consistent 15-minute energy balance per site, with source and quality labels.
Compare tariffs and battery schedules with stated assumptions. Decision support, not automatic control.
One model, one sample day, two battery schedules. The difference is visible — and so are the assumptions. In the pilot we run the same calculation on your data.
19 Jun 2026 · fictional ToU tariff · 96 intervals
Perfect foresight: the schedule optimises for the sample day's known PV and consumption — an upper bound. In the product the plan is built from a forecast and a 7-day average.
Not measured savings or a promise. Excludes battery wear, fixed fees and actual utility billing.
Today the platform is shown on simulated demo data. Live vendor connectivity is verified during the pilot, on your equipment.
Solar, battery, grid and EV. The data source used in this demonstration.
GreenHESS, Tesla and Fronius: data connections are in development. Live operation is verified in the pilot, on your devices.
Connecting real market price and weather data is planned. Demo tariffs and weather are fictional.
A joint pilot instead of a price list: in a short time you see what the platform shows on your customers' or sites' data.
A 30-minute online call: goals, equipment, data sources.
A few selected sites with read-only access. No device control.
An overview from real data with visible assumptions — and a proposal for next steps.
For partners: a monthly subscription with a site allowance, your own branding and a service level. The concrete offer follows the pilot.
Request a pilot callThe platform sends no commands to devices. Optimisation is advice and simulation.
Per-customer isolation at the database level.
Who sees and changes what, by role; access is logged.
Vendor access keys are stored encrypted.
No. The platform only reads: it does not start, stop or change anything. Optimisation is advice and simulation; the operator decides.
It is vendor-independent. GreenHESS, Tesla and Fronius connections are in development; live connectivity is verified during the pilot on your equipment. Other vendors are assessed on request.
No. Every value comes from a simulated sample day and is labelled DEMO / SIMULATED. Real data is shown in the pilot, on your systems.
Yes. The interface name, logo and primary colour are configurable per partner.
With data, yes: a consumption profile for the offer, baseline and post-measure time series to evidence savings. Certification is done by an energy auditor and financing by the partner — the platform replaces neither.
For partners, a monthly subscription with a site allowance. The concrete offer is prepared after the pilot, sized to your installed base.
A 30-minute online walkthrough: the platform, the demo and a pilot plan for your systems.
Demo data. Your pace. No device control.